Views
Introduction to views
Views are the different page layouts you see throughout the Brinqa platform, including reports. You can configure views to display exactly the information your team needs to see. This section will cover general information about views and how to create and modify them.
Views are associated with data models. Brinqa includes several data models out of the box with preconfigured views. There are three main views associated with a data model: show, list, and form. The list view displays a table of all of the instances of that data model (e.g. all hosts). The show view is the detailed view of a single data model instance with its associated attributes (e.g. the details about a particular host). The form view is used to create or edit a new instance of that data model manually via a form. By default, these views will contain a subset of attributes from the data model (e.g. IP address and operating system).
Creating a new data model and selecting the base model will create a list, form, and show view using the default template associated with the base model.
In addition to modifying the views that are created automatically, administrators can create additional views and place them in the left navigation bar of their Brinqa application.
Administration > User Interface > Views will take you to the Manage Views page, which displays a list view of views and allows for the creation of new ones.
Table 1: List view contents
| Columns | Description |
|---|---|
| Title | Title of the view. The title will appear on the list view of all views and as the page title for user-created views. |
| Type | Type of view. The type determines when the view is displayed. E.g. form type views for a particular data model will be displayed whenever anyone needs to edit information on an instance of that data model. |
| Description | Description of the view. The description is searchable using the search bar. |
| Created by | User who created the view. A blank “created by” field means the view was created automatically by the system. |
| Last Updated | Last time this view layout was updated. |
Creating a view
While administrators will more often want to modify an existing view, they may want to create a new view in some circumstances. For example, if there’s a complex search query that’s frequently performed on vulnerabilities, building a list view that pre-filters results according to that query may save users time.
- Navigate to Administration > User Interface > Views
- Click Create View
- Fill in the following and click Create:
Table 2. New view properties
| View | Description |
|---|---|
| Title | Title of the view. The title will serve as a page title, appearing at the top of the view and in browser tabs. |
| Name | Reference name for queries and scripts. The name can contain only letters, numbers, and underscores. |
| Type | The type of view you want to create. See table of view types below. |
| Description | Description of the view. Description is displayed on the view list view and can be searched from the search bar. |
| Accessible from | Specifies whether this view will be available to all Brinqa applications or only the application you are currently administrating. |
Types of views
Table 3. Types of views
| View | Description |
|---|---|
| Dashboard | Dashboard views are the homepages for each of your Brinqa applications. They display an overview of what’s happening in your system. Dashboard views can be found by searching “home” on the Manage Views page. |
| Report | Report views are reports. Reports can be created from the administrative back end or the front end. For more information on reports, see the Reporting section of the documentation. |
| List | List views are pages that display multiple instances of a data model in a list and allow you to sort, filter, and delete those instances. Your Vulnerabilities page is a list view. |
| Form | Form views are pages where forms allow you to create or modify data associated with attributes. Attributes are the fields on the form. The Create Ticket page is a form view. |
| Show | Show views are pages that display information for one instance of a data model. If you navigate to a particular ticket to review its contents, that page is a show view. |
Once the view has been created, its layout and contents can be edited using the view builder UI.
Table 4: View builder UI
| Buttons | Description |
|---|---|
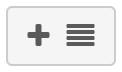 | Adds a row to the view |
 | Edit view details / Edit view source |
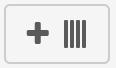 | Add column to associated row in view |
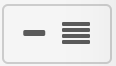 | Remove associated row from the view |
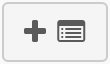 | Add a single section or visualization to associated column. Section options listed below. |
 | Remove associated column from the view |
Views vs. Sections
There are list, form, and show views and list, form, and show sections. The sections are the individual units that compose the view. A show view can contain a show section, but it can also contain a list or form section. If a show view contains a list section, the list section retains its usual properties and isn’t changed by its placement on a show view.
Types of sections
Sections are the major components of a view and contain individual data visualizations. In addition to the data visualizations available on reports, other views can add list, form, and show sections. To see more in-depth information about visualizations, navigate to the Visualizations section of the documentation.
Table 5: View sections and data visualizations
| Visualization | Description |
|---|---|
| List | Displays a list of instances of a data model. E.g. a list of all tickets. |
| Form | Displays an editable form for instances of a data model. E.g. a form to edit the contents of an individual ticket. |
| Show | Displays existing data from an instance of a data model. E.g. a page displaying the contents of an individual ticket. |
| Table | Displays a table of values. Tables are useful for displaying any information that’s best in a list. For example, lists of top priority vulnerabilities or tickets and lists of network segments by business unit. |
| Single Value | Displays a single value. Single values are useful for displaying things like the total number of open tickets, the highest risk IP, or any other single data point. |
| Line | Displays a line trend chart. Line trend charts are useful for seeing comparisons of data over time, like the number of new vulnerabilities week to week. |
| Area | Displays a line trend chart with area between the line and 0 filled in. Area charts can be used any time a line chart would be, but are preferable when tracking multiple lines, since the shading helps differentiate the elements being tracked. |
| Column | Displays vertical columns of data. Columns are useful when visualizing relative counts of data. |
| Bar | Displays horizontal columns of data. Bar and column visualizations can be used interchangeably, but bars may work better when the bar/column labels are long. |
| Pie | Displays a pie chart. Pie charts are useful for displaying proportional information like percentages. |
| Donut | Displays a donut chart. Donut and pie charts can be used interchangeably. |
| Heatmap | Displays data in the form of a heatmap. Heatmaps are useful for displaying information about things like the concentration of certain events in certain times or locations. For example, concentration of vulnerabilities by host by month. Colors are used to indicate the level of concentration and whether that amount is problematic. |
| Treemap | Displays data in the form of a treemap, displaying hierarchical data as nested rectangles. Treemaps are useful for displaying proportional information like percentages. |
Adding a list, form, or show section
- Click the Add Section button associated with the column where you want the section to appear
- Select List, Form, or Show from the section options
- Enter a title for the section
- Enter the data model the section should display information from
- Click Add
Configuring section appearance
You can modify the appearance of list, form, and show sections, including what information they display, whether it's sortable, and how values render.
Each section will have a combination of the appearance settings listed below.
- Click the edit button associated with the visualization
- Select Display and fill in the following:
Table 6. Section display properties
| Tab | Setting | Description |
|---|---|---|
| General | Group By | Groups items appearing on a list section by an attribute in their data model. E.g. tickets can be grouped by state. |
| Sort by | Sorts a list view by a selected attribute. | |
| Page Size | Number of items in a list section to be displayed at once on a page. | |
| Columns | Display | Whether or not the column or field will be displayed on the view. |
| Width | Width in pixels of a column in a list section. | |
| Rendering | How a value on a list, show, or form section renders. See the table below for rendering options. |
Table 7. Column rendering options
| Option | Description |
|---|---|
| Lozenge | Displays the value in a lozenge-shaped container.
|
| Link | Displays the value as a link. This is useful for sections that display lists of specific tickets or vulnerabilities. The link will take the user to the show view of the linked item. |
| Icon | Converts specific values to a Font Awesome icon. |
| Code | Displays code properly formatted in a block. |
| Number | Displays the value as a number and allows you to specify the group delimiter, decimal mark, and number of decimal places. |
| Star Rating | Displays the value as a star rating out of five stars. |
| Text | Displays the value as text. |
| Multiple Attributes | Combines multiple attributes into one value for the field. Attribute reference names must be contained within double curly brackets and with any connecting text or symbols placed around them. E.g. {{ip_address}}:{{os}} could return 10.17.204.56:Windows 7 and {{ip_address}} with {{os}} could return 10.17.204.56 with Windows 7. |
| Date | Displays a timestamp value as a date. |
| Date Time | Displays a timestamp value as a date and time. |
| Sparkline | Displays a small trend chart of historical values of that field rather than a single current value. The attribute must have “Track History” set on it at the data model level in order for this rendering to work. |
Adding a visualization section
Visualization sections are usually used on dashboard or report views to provide a graphical representation of the current status or historical trends of data.
- Click the Section button associated with the column where you want the visualization
- Select a visualization type and fill in the following:
Table 6: New visualization properties
| Fields | Description |
|---|---|
| Title | Title of section. This will appear above the section on the report. |
| Data Model | Data model the visualization will pull information from. If you selected a data model on the Edit report modal in order to add inputs, only that data model can be selected for visualizations. |
| Measures | Calculations performed on objects within the system. Measures will be discussed in greater detail below. |
| Dimensions | How the data from a measure will be grouped. Dimensions will be discussed in greater detail below. |
| Limit | Limits the amount of data pulled from selected data model. Usually this means limiting the number of rows or columns of information displayed. |
| Sort by | Sorts visualization by a selected attribute, ascending or descending. |
Measures
Measures and dimensions are how you choose exactly what information is displayed in your visualization.
Measures are calculations performed on objects within the system. In Brinqa applications, you select an aggregate function and the objects of that function are determined by the data model you select. So, for example, if you select the Ticket data model and Count function, the calculation you receive is the total number of tickets.
Table 7. Measure functions
| Function | Description |
|---|---|
| Average | Average value of the selected attribute. The average function can only be applied to attributes that are numeric values. |
| Count | Number of instances of the selected data model in the system. |
| Count Unique | Number of unique instances of the selected data model in the system. |
| Max | Current maximum value of the selected attribute. The max function can only be applied to attributes that are numeric values. |
| Min | Current minimum value of the selected attribute. The min function can only be applied to attributes that are numeric values. |
| Sum | Sum of values of the selected attribute. The sum function can only be applied to attributes that are numeric values. |
| Unique | Number of unique values of the selected attribute in the system. |
Dimensions
Dimensions are how data from the selected measure will be grouped. For example, in a visualization of total tickets per month, “total tickets” is the measure and “per month” is the dimension. The count of total tickets is divided into groups according to the month in which they were created.
All attributes of a data model will be selectable as dimensions, but some will make more sense than others as sorting options. In general, the only ones that will never make good candidates for dimensions are completely unique attributes like ID.
Multiple dimensions can be selected for the same visualization. This allows you to display things like total vulnerabilities per business unit per quarter.
Transformation
Dimensions that use timestamp attributes will have a transformation option when you select them, which allows you to determine the granularity of the dimension. For timestamps this means whether you’d like to look at the year, quarter, month, week or day of the timestamp.
Buckets
Dimensions that use numeric attributes (including timestamps, which are stored as integers) will have a bucket option. Buckets allow you to set ranges for dimensions. For example, vulnerability risk scores run from 0 to 10 but could be put into buckets of low (0-2), medium (3-6), and high (7-10) if that was a more desirable way of viewing the information.
Configuring appearance
Once a visualization has been created users can modify its appearance, including the colors, grid lines, max values, and how the data stacks.
Most visualizations have the same appearance options, but tables and single value visualizations have slightly different modals. The tables below will cover each version of appearance modification.
- Click the edit button associated with the visualization
- Select Display and fill in the following:
Table 8. Display properties for line, area, column, bar, pie, donut, heatmap, and treemap charts
| Tab | Field | Description |
|---|---|---|
| General | Stacking | Whether different data from the same attribute appears separately or stacked on column and bar graphs. A stacked bar or column graph might show the total vulnerabilities on a host divided proportionately by severity. For a picture of a stacked bar graph, navigate to the Visualizations page.
|
| Empty Values | What the visualization should do if there are empty values for some sections of data (e.g. on a line chart with weeks along the x-axis, what to do with weeks where there was no data). | |
| Options | These are general options for the visualization's display. | |
| Axes | Title (vertical and horizontal axes) | The title of that axis |
| Value (vertical and horizontal axes) | Which measure or dimension should appear on that axis | |
| Type (vertical and horizontal axes) | How data should be plotted. | |
| Labels format (vertical and horizontal axes) | Characters can be added before and after label values using the variable {value}. E.g. {value}% would convert a labels like 10, 20, 30, 40 to 10%, 20%, 30%, 40% | |
| Size | Determines the minimum and maximum values along the vertical axis, and what interval grid lines should occur at. | |
| Reversed direction (vertical and horizontal axes) | Reverses the sort of values along the axis | |
| Plot line | A line stretching across the plot area, marking a specific value. The value where the line should occur, and color, type, and width of the line can be selected. | |
| Group by | Dimension or measure to group data by. | |
| Label angle | Angle of labels on the horizontal axis. Changing the angle sometimes allows larger labels to be displayed. | |
| Appearance | Theme | Allows selection of a color theme for the chart, the default white theme or a "Darcula" a dary gray theme. |
| Background | Sets the background color of the chart using color names or hex codes. | |
| Text Color | Sets the text color of the chart using color names or hex codes. | |
| Line Color | Sets the line color of the chart using color names or hex codes. | |
| Border | Enables a border around the visualization. | |
| Border color | Sets the color of the border using color names or hex codes. | |
| Default colors | The colors field allows you to specify colors by name or hex code to be used as the default color. The system will randomly assign the colors to each group with a color. | |
| Color by data point | Sets color of data points by their shared horizontal axis value. E.g. all data points in one column will be the same color. | |
| Conditional colors | Conditional fields allow you to specify which values should be which colors using color names or hex codes. | |
| Tooltip enabled | Shows a tooltip with values when mousing over parts of the chart | |
| Share between series | If multiple values exist at a certain horizontal axis value (e.g. if there are multiple lines on a line chart) all values at that horizontal point will display in one tooltip | |
| Legend enabled | Enables the chart legend | |
| Item layout | Determines whether legend items are stacked horizontally or vertically | |
| Alignment | Determines whether legend items appear at the center, left, or right of the chart. | |
| Vertical alignment | Determines whether legend items appear at the top, side, or bottom of the chart. |
Single value and angular gauge appearance
Table 9. Appearance properties for single value and angular gauge visualizations
| Tab | Field | Description |
|---|---|---|
| General | Value | If there are measures and dimensions, this field determines which of those values is displayed as the single value. E.g. If you wanted to display information about the most vulnerable IP, it would allow you to choose whether to display the number of vulnerabilities it has or its IP address. |
| Rendering | Determines whether the value is displayed as a number, star rating, icon, or other options. | |
| Alignment | Determines the alignment of the value within the visualization. | |
| Range (angular gauge only) | Specifies the range values fall in. E.g. a risk score gauge would have the range of 0 to 10 | |
| Before/After/Above/Under Label | Allows users to enter text that will appear before, after, above, or under the value in the visualization, and choose the text's font size. | |
| Drilldown | Allows readers of the report to click on single values and be taken to list views of the object(s) they represent. E.g. all critical severity bugs in production. | |
| Appearance | Border | Enables a border around the visualization. |
| Border color | Sets the color of the border using color names or hex codes. | |
| Section color | Determines the background and text colors of the visualization | |
| Conditional colors | Allows user to specify that certain values in the visualization should cause the background and text colors to change, e.g. become red when a value is critical | |
| Font Size | Maximum and minimum font sizes for displaying the single value text. This field is useful if the size of the contents of the single value field could vary significantly. | |
| Under Label | Text that will appear below the single value. This field is the title of the visualization and will update the title. | |
| Colors | Default | Default coloring will always display the single value according to the color scheme set in the Default Background and Default Text fields. |
| Conditional | Allows you to specify conditions on the value that will change its display colors. E.g. if the average risk score is above 8, display the average risk score in red. | |
| Formatting | Group Delimiter | The punctuation mark used to delimit thousands groups. |
| Decimal Mark | The punctuation mark used to indicate decimal places. | |
| Decimal Places | Allows you to specify how many decimal places to display. |
Table appearance
Tables have one central appearance setting, which is how values in columns render. There are a number of ways to render values including as links, icons, star ratings, and sparklines. You can also set simpler rendering options, like how many decimal places appear for numeric values.
Table 10. Table column rendering options
| Option | Description |
|---|---|
| Lozenge | Displays the value in a lozenge-shaped container.
|
| Link | Displays the value as a link. This is useful for tables that display lists of specific tickets or vulnerabilities. The link will take the user to the show view of the linked item. |
| Icon | Converts specific values to a Font Awesome icon. |
| Code | Displays code properly formatted in a block. |
| Number | Displays the value as a number and allows you to specify the group delimiter, decimal mark, and number of decimal places. |
| Star Rating | Displays the value as a star rating out of five stars. |
| Text | Displays the value as text. |
| Multiple Attributes | Combines multiple attributes into one value for the field. Attribute reference names must be contained within double curly brackets and with any connecting text or symbols placed around them. E.g. {{ip_address}}:{{os}} could return 10.17.204.56:Windows 7 and {{ip_address}} with {{os}} could return 10.17.204.56 with Windows 7. |
| Date | Displays a timestamp value as a date. |
| Date Time | Displays a timestamp value as a date and time. |
| Sparkline | Displays a small trend chart of historical values of that field rather than a single current value. The attribute must have “Track History” set on it at the data model level in order for this chart to work. |
Using filters
The Filter option allows you to fine-tune the data that appears in a visualization, showing only relavant subsets.
- Click the edit button associated with the view
- Select Filters.
- Add filters using the filter clause interface:
Table 11. Filter clause interface
| Element | Description |
|---|---|
| Add AND Clause | Specifies conditions that must be met. (E.g. owner is Dave) |
| Add OR Clause | Specifies an alternate set of conditions that could be met. (E.g. owner is Dave OR owner is Marg) |
| Reset Filters | Clears all the filter options. |
| Attribute | Attribute referenced for the condition. (E.g. owner) |
| Operator | Operator for the specified value. (E.g. greater than, equal to, is not, contains) |
| Value | Value the operator compares the data to. (E.g. a specific name or host) |
| AND | Adds an additional AND condition to the associated section. |
| OR | Adds an OR between two different conditions within a clause (e.g. owner is Marg and status is New OR Active). These ORs must share the same attribute. E.g. Status is Active OR New, but not Status is Active OR Priority is Critical. |
Adding a view to navigation
Once a new view has been finalized, it should be added to the left navigation bar so users can access it.
- Navigate to the Brinqa Platform application
- Navigate to Administration > User Interface > Navigation Menus
- Click the JSON file associated with the application whose navigation you want to modify
- Insert a modified version of the following code into the appropriate place:
       {
          "items": [
            {
              "link": {
                "model": "datamodel_reference_name",
                "type": "VIEWTYPE"
              },
              "options": {
                "icons": {
                  "16": "Font Awesome icon name",
                  "48": "Larger Font Awesome icon name",
                  "128": "Even larger Font Awesome icon name"
                }
              },
              "order": 1,
              "title": "Link Title",
              "visibility": {
                "active": true,
                "roles": "System Administrator"
              }
            }
          ],
          "order": numeric rank relative to other links,
          "title": "Page Title"
        }
TUTORIALS: Modifying existing views
Administrators may want to modify views to change their layouts, what information they display, or how it’s ordered. Below are some common modifications and how to perform them.
Danger
Never modify views with “base_model” or “role” in their titles.
Moving a section on a view
- Navigate to Administration > User Interface > Views
- Navigate to view you want to edit
- (Optional) Create a new row or column to move the section to
- Grab and drag the section to the desired location
- Click Done to save the changes
Adding/removing columns from a list section
- Navigate to Administration > User Interface > Views
- Navigate to view you want to edit
- Click the Edit button associated with the list section on the view
- Select Appearance/Display from the drop down menu
- Select the Columns tab
- Check/uncheck "Enabled" for the desired columns
- Click Update
- Click Done to save the changes
Changing the order of columns on a list section
- Navigate to Administration > User Interface > Views
- Navigate to view you want to edit
- Click the Edit button associated with the list section on the view
- Select Appearance/Display from the drop down menu
- Select the Columns tab
- Click and drag columns to change their order
- Click Update
- Click Done to save the changes
Changing the sortability of columns on a list section
- Navigate to Administration > User Interface > Views
- Navigate to view you want to edit
- Click the Edit button associated with the list section on the view
- Select Appearance/Display from the drop down menu
- Select the Columns tab
- Check/uncheck "Sorting" for the desired columns
- Click Update
- Click Done to save the changes
Changing the number of pages displayed on a list view
- Navigate to Administration > User Interface > Views
- Navigate to view you want to edit
- Click the Edit button associated with the list section on the view
- Select Appearance/Display from the drop down menu
- Select the General tab
- Change the Page Size field to the desired number
- Click Update
- Click Done to save the changes
Adding/removing fields on a form section
- Navigate to Administration > User Interface > Views
- Navigate to view you want to edit
- Click the Edit button associated with the form section on the view
- Select Appearance/Display from the drop down menu
- Select the Columns tab
- Check/uncheck "Enabled" for the desired fields
- Click Update
- Click Done to save the changes